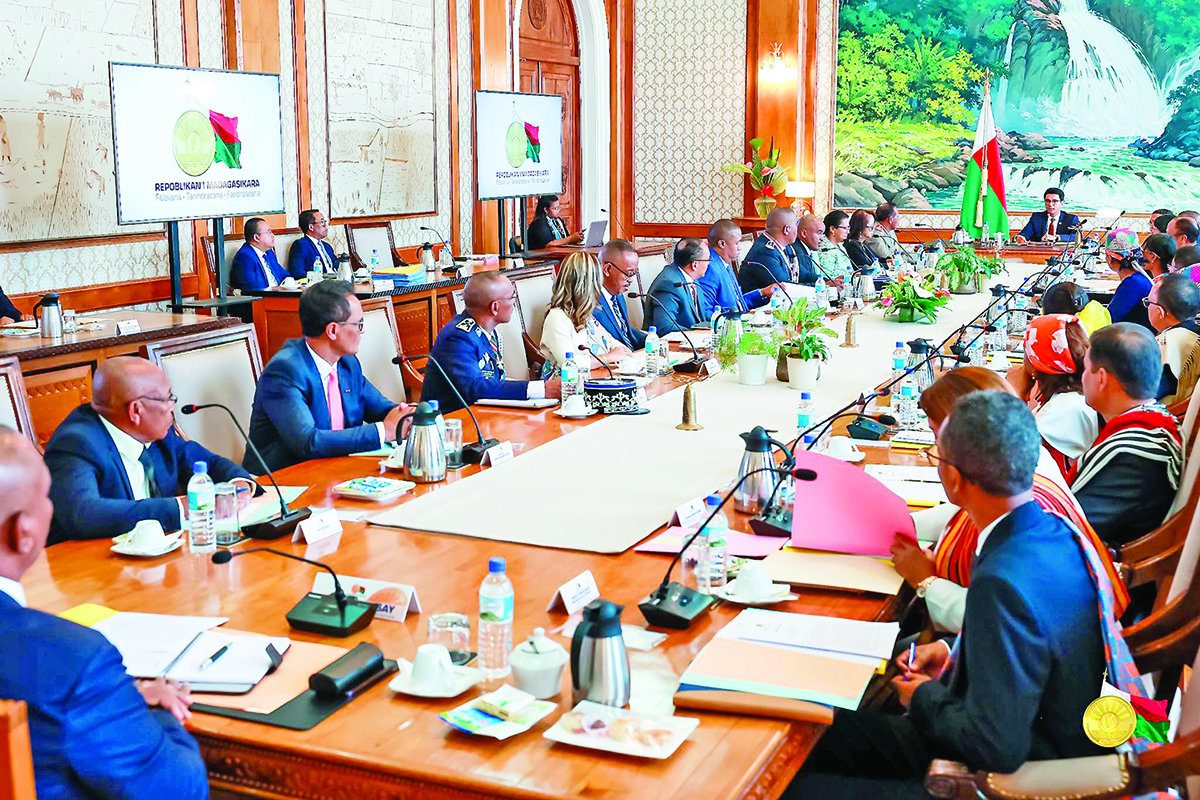
Adoption du décret concernant la dématérialisation des procédures de création, de modification et de dissolution des entreprises: 48 heures pour immatriculer une entreprise.18 novembre 2024
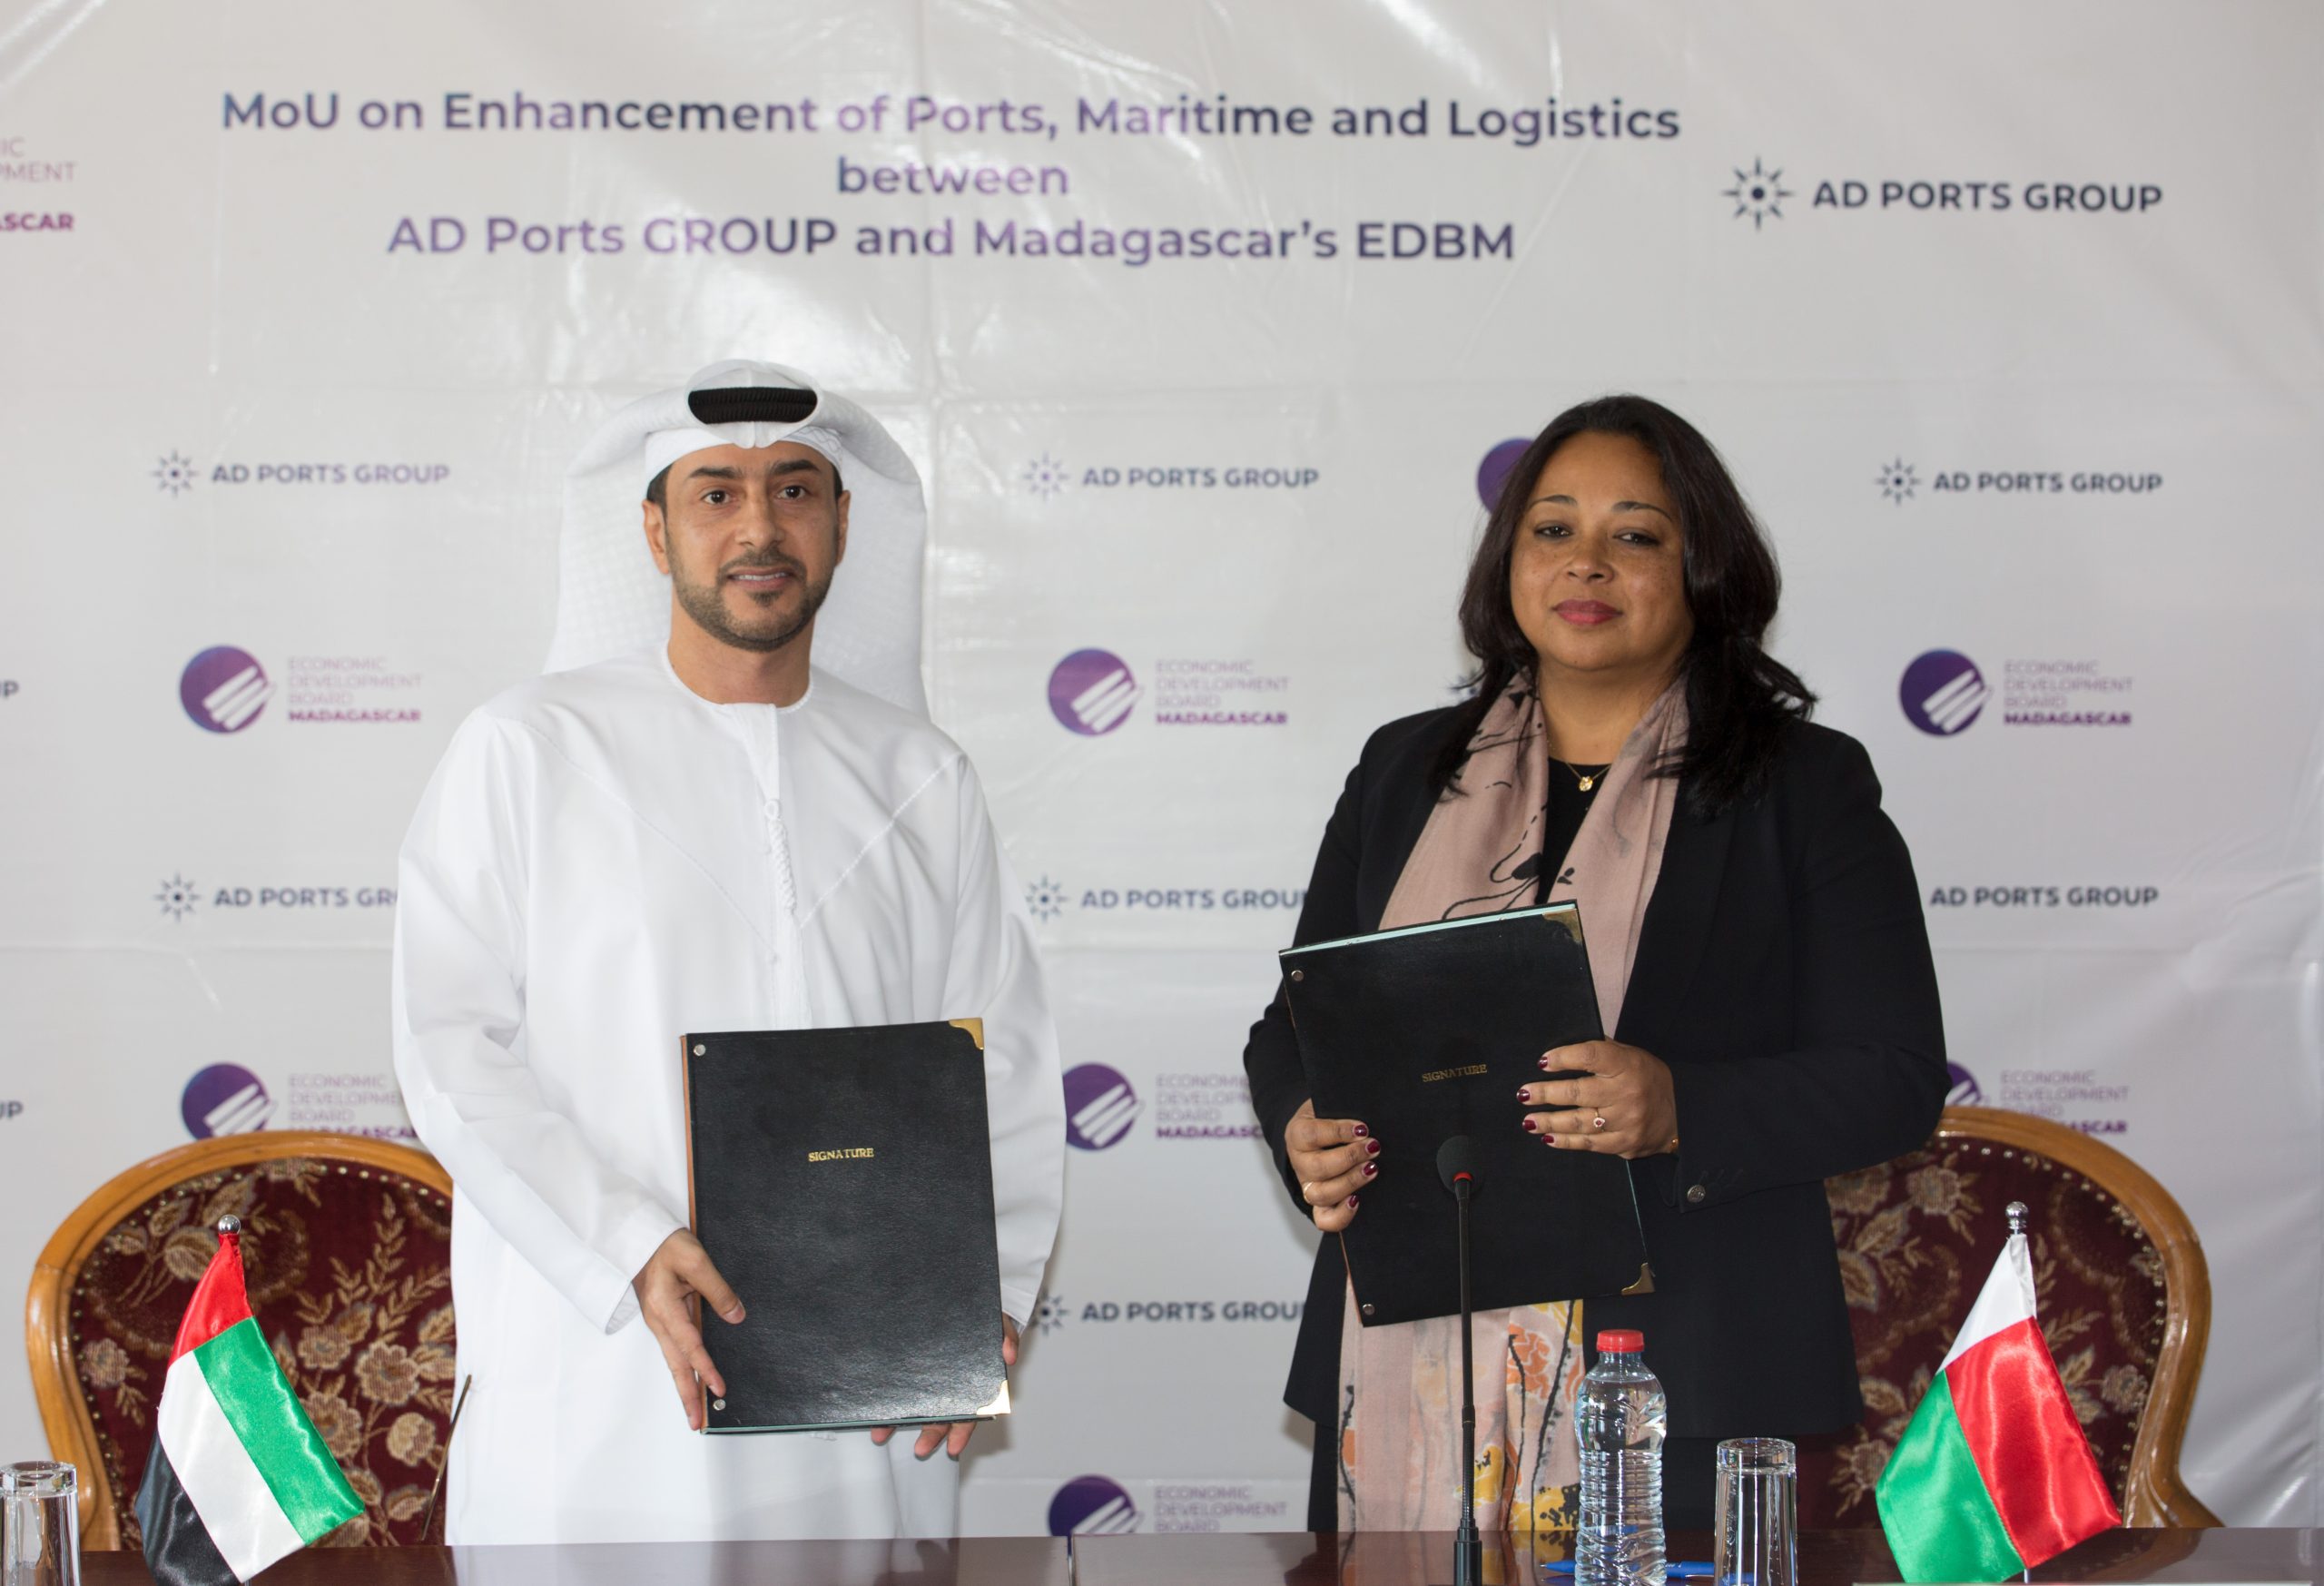
Abu Dhabi Ports Group and EDBM sign a Memorandum of Understanding (MoU) to explore the Development of Ports, Maritime and Logistics1 juin 2024
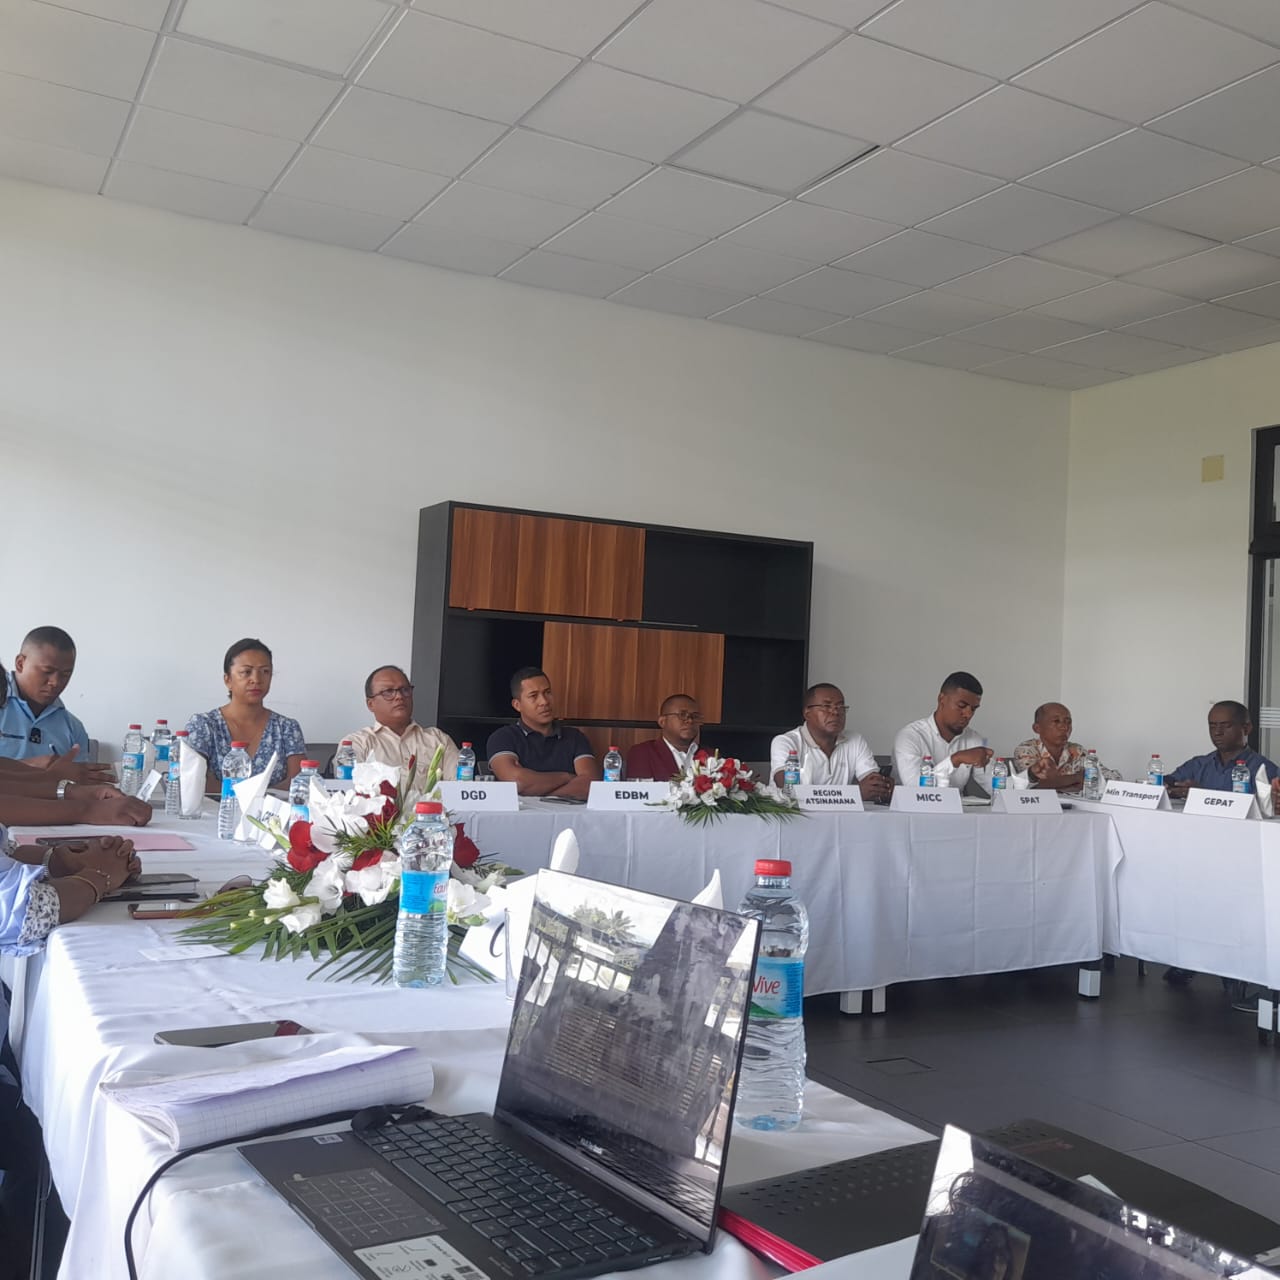
DIALOGUE PUBLIC-PRIVÉ : VERS L’AMÉLIORATION CONTINUE ET SOUTENUE DE LA PERFORMANCE EN MATIÈRE DE FLUIDIFICATION DU PASSAGE PORTUAIRE À TOAMASINA.24 octobre 2023